What Gets Measured, Gets Done.
Welcome to the second post in our 7 day challenge to help you rock 2019. If you missed the first one, you can find it here.
As you begin to plan for 2019, it’s important to stop and look at where you’re at right now. We know that “what gets measured, gets done. I like to remind myself to track the metrics that are important to me and the EventPreneur Success Club and ignore the rest.
[bctt tweet=”If you don’t know where you’ve come from, you don’t know where you’re going. ~ Maya Angelou #eventpreneur” username=”@mahoganeyjones”]
Business planning for future success is all about data. You can work most efficiently and spend your time and money most effectively if you know exactly where you are starting from. By recording data, you can start to see what’s working, what isn’t, and what trends are starting to play out. And it all starts with recording where you’re at right now.
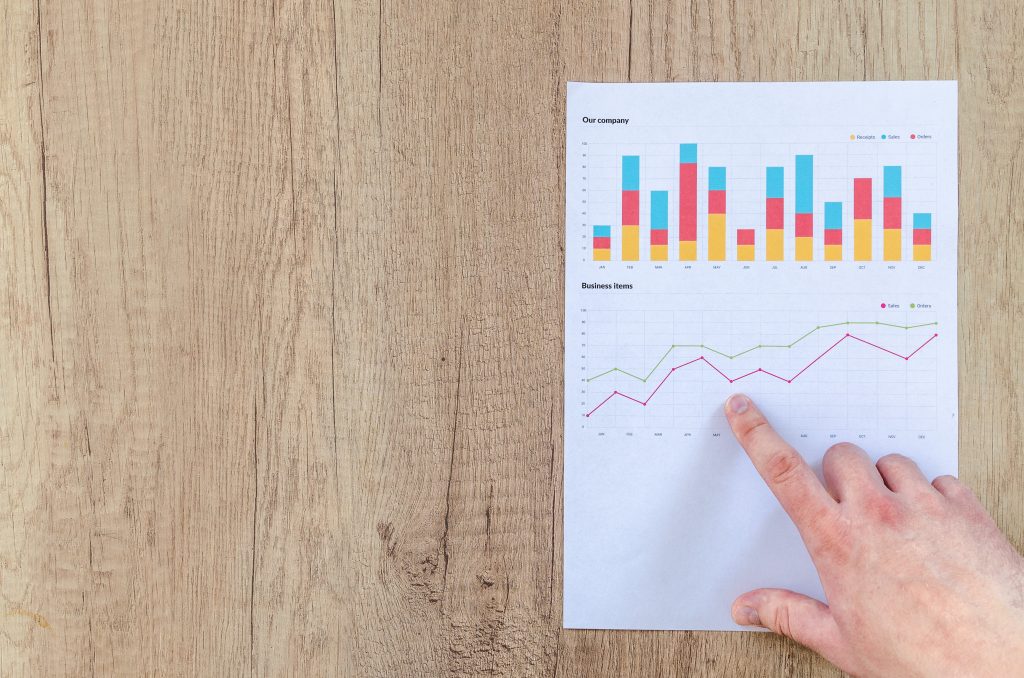
First though, let’s take a look at some of the data you want to record and how you want to record this information. You can write it down by hand in a notebook, open up a word document to do it digitally, or use a spreadsheet. I prefer a spreadsheet because I have the option to have it calculate fun additional information like weekly and monthly averages and even map it all out in graphics to help me get a clearer picture.
There are a few things, however, that most business owners will want to track. (Click here for a list of 6 KPIs that profitable eventpreneurs watch.)
Traffic – To grow you need to expand your reach. That means getting more traffic, but also engaging the people that come to your site by encouraging them to click around and read more. Good things to keep track of are total visitors, unique visitors, bounce rate, and of course where the traffic is coming from.
List / Subscribers – Your next goal is turn your traffic into subscribers. Here you want to track total number of subscribers, conversion rates for each of your opt-in forms and pages, open rates for your emails, and also unsubscribes. As you start to collect and review this data regularly, you’ll get a much better picture of your subscribers.
Clients – Subscribers are great, clients are better. Start by keeping track of how many total customers you have and how many purchases per day, week, and month. Other good numbers to look at are total lifetime value of your average customer, repeat purchases, and refund rates.
Income & Expenses – Last but not least, look at your bottom line. This is your typical accounting data. You want to keep track of your income as well as your expenses. With those two sets of numbers, you can easily calculate your overall profit. I find it helpful to look at profit for the month, but track income on a weekly basis.
Yes, you can look at most of this data in various different places like Google Analytics, your shopping cart, and your autoresponder service for example, but it’s important to have it all in one place. This makes it much easier to connect the dots and see the relationships between the different sets of numbers.
Now that you have your initial data collection set up, make it a habit to update the numbers regularly so you can see what’s working, what isn’t, and how much you’re growing as you move through the coming months and years. Even better, set reminders in your calendar to check your data weekly, monthly and quarterly.